Litecoin LTC | This Big Bullish Reversal Pattern Will Start The King Of All Bullish Moves
- Get link
- X
- Other Apps
Hi friends, hope you are well and welcome to the new update on Litecoin (LTC).
Different harmonic moves and their chain reaction:
In the month of January 2021, I shred three ideas.
One was the bullish Shark formation on the weekly time frame that was the smallest pattern

Then we had the bigger pattern on the same weekly time frame and this was a bullish Butterfly

and the biggest pattern was the bullish BAT on the 2-month time frame chart.

Finally, the price action moved up from the buying zone of the smallest Shark pattern and crossed the sells zone. Then started moving up from the bigger pattern of the bullish butterfly and hit the sell zone, but so far we have a very small bullish spike on the biggest time frame chart of bullish bullish BAT . This is a big indication that a big move is still remaining.

Different support and resistance levels:
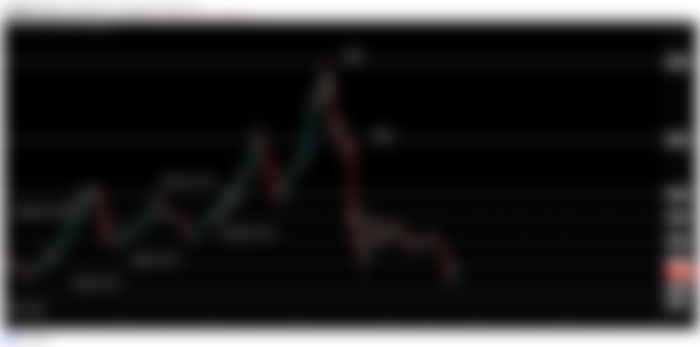
After the bullish divergence from the different harmonic patterns (discussed earlier), the price of the LTC has surged more than 700%. Now it can be seen that after breaking out the different resistance levels the price action has found the final resistance at $400. And after getting rejected by this resistance level the price action of the Litecoin broke down the $300 then $230 and then $170, $140 support levels respectively. Now it is bounced from the $110 support level.
Down channel:
On the daily time frame, the price action has started the formation of the down channel. The formation of this pattern was started in the last week of May 2020. Recently a very strong bearish spike can be seen even beyond the support of this channel. However, the price action could not close below the support and reversed back inside the channel. Now after this bounce, the priceline of Litecoin is moving towards the upside to make another attempt to break out the resistance.

Another big bullish Cypher pattern:
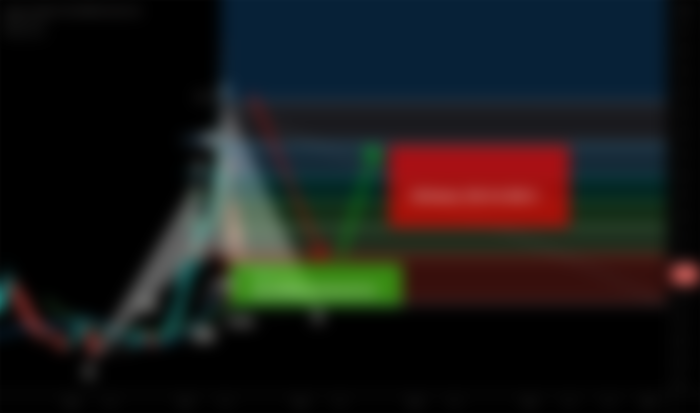
This time On the 2-week time frame chart, the price action has formed a big Cypher pattern. There are also 25 and 50 simple moving averages supports in the buying zone.
Buy and sell targets:
Buy between: $144.48 to $91.49
Sell between: $186.18 to $286.33
Stop loss:
The maximum extent of the potential reversal zone $91.49 can be used as stop loss.
Conclusion:
Litecoin is one of the top altcoins which has been surged more than 700% during this bull run. However, the previous harmonic patterns and the formation of another big harmonic move are signaling towards another very big rally to the upside in the long term.
You can also support my work at Patreon:
https://www.patreon.com/moon333
In order to play and watch the current performance of the chart you need at least a free account on tradingview:
https://www.tradingview.com/gopro/?share_your_love=moon333
KuCoin is one of the best exchange to find crypto gems:
https://www.kucoin.com/ucenter/signup?rcode=rJSDVT3
Link for Binance exchange, to trade crypto:
- Get link
- X
- Other Apps
Comments
Post a Comment