Posts

Showing posts from May, 2020

Zcash (ZEC) Has Formed Very Big Bullish Gartley Pattern For Upto 173% Bullish Rally

Image
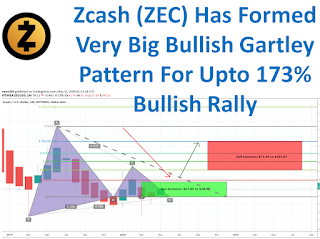
Hi friends hope you are good, This time I have brought another bullish trading idea for you with complete stop loss strategy.   Very big bullish Gartley pattern: This time on month chart Zcash (ZEC) has formed a very big   harmonic   Gartley  pattern and entered in potential reversal zone.   Click here to create free account on tradingview to watch and play the chart on realtime     Buying And Sell Targets: The buying and sell targets according to  harmonic   Gartley pattern  and its Fibonacci sequence should be:   Buy between: $57.06 to $38.79   Sell between: $71.44 to $105.97   Stop Loss: The potential reversal zone area that is up to $38.79 can be used as stop loss in case of complete candle stick opens and closes below this level.   Possible profit and loss ratio: As per above targets this trade has the profit possibility of 173% and as per above mentioned stop loss, the loss possibility is 32% Note:  This idea is education purpose only and not

EOS Has Formed Very Big Bullish Gartley Pattern For Upto 143% Bullish Rally

Image
Hi my friends hope you are good, This time I have brought another beneficial trading idea for you with complete stop loss strategy.   Very big bullish Gartley pattern: This time on 2 month chart EOS has formed a very big   harmonic   Gartley  pattern and entered in potential reversal zone.   Click here to create free account on tradingview to watch and play the chart on realtime   Buying And Sell Targets: The buying and sell targets according to  harmonic   Gartley pattern  and its Fibonacci sequence should be:   Buy between: $4.26 to $3.06   Sell between: $5.20 to $7.45   Stop Loss: The potential reversal zone area that is up to $3.06 can be used as stop loss in case of complete candle stick opens and closes below this level.   Possible profit and loss ratio: As per above targets this trade has the profit possibility of 143% and as per above mentioned stop loss, the loss possibility is 28% Note:  This idea is education purpose only and not intended to

Will XRP Breakout This Key Level Resistance To Achieve Highest Price Ever???

Image
Hi friends hope you are doing well and welcome to the new update on Ripple even though this coin is less bullish comparatively to other top cryptocurrencies however it is giving some bullish signals let’s talk about them. Finally priceline is showing bullish bounce: On the daily chart the priceline of XRP is moving within an up channel since Mar2020. Recently on 25th May XRP was reached at the support and got bounced from there. Now we can see a sequence of bullish candlesticks is being prepared. Even though these candlesticks are not as that much bullish as they should be after this bounce. However the continuation of green candlesticks is a bullish signal more over we can see that buying volume is being appeared with the continuation that can lead the priceline to the resistance of this channel. Indicators are turning bullish: If we notice the different indicators and oscillators on the daily chart then all are turning bullish. For example if we watch the moving average convergence d

How Much Bullish Matic Network Can Be??? | Matic Network Mainnet Launch

Image
Hi friends hope you are doing well today I want to talk about the Matic network, how it is turning bullish and how much the mainnet launch at the end of May can affect the price action of Matic token. As per coinpaprika.com and coinmarketcal.com the mainnet launch of Matic network is expected on 31st May 2020.  Therefore the current bullish move of the Matic can be different from the previous bullish rallies and we can expect some exceptional moves in the price action of Matic network. Like we have recently witnessed in case of Tfuel.       Movement within the channel and bullish signals: Now let's watch some technical analysis and on the daily chart it can be easily seen that the price action of Matic network is moving in a parallel channel since December 2019. The movement of the price action within this channel is very much synchronized with stochastic and directional movement indicators. There are more than 5000 indicators available on the tradingview and I always research to f

Post Bitcoin Halving Drop ???

Image
Hi friends hope you are well. Today I want to discuss that is it necessary for the Bitcoin to drop pre or post halving? In order to understand this principle we need to see the previous Bitcoin halvenings then we will move to the current halving. If we watch the Bitcoin halving 2012 then we can observe that before halvening the price action dropped more than 25% and this bearish move was ended before the halving. On the other hand if we watch the Bitcoin halving 2016 then the price action started dropping down before the event and this bearish move was continued even after the halving event. During this drop BTC lost more than 40% of its value. Now if we move to the current halving event then it can be seen that before halving we have witnessed a very strong bearish move that leaded the BTC more than 65% down in the March 2020. Most of the traders say that this drop was due to the world pandemic issue. Therefore it is possible that this down move doesn't have any connection with pr